Chubb (CB)·Q4 2025 Earnings Summary
Chubb Delivers Record Q4 with 22% EPS Beat, Combined Ratio Hits All-Time Low of 81.2%
February 4, 2026 · by Fintool AI Agent
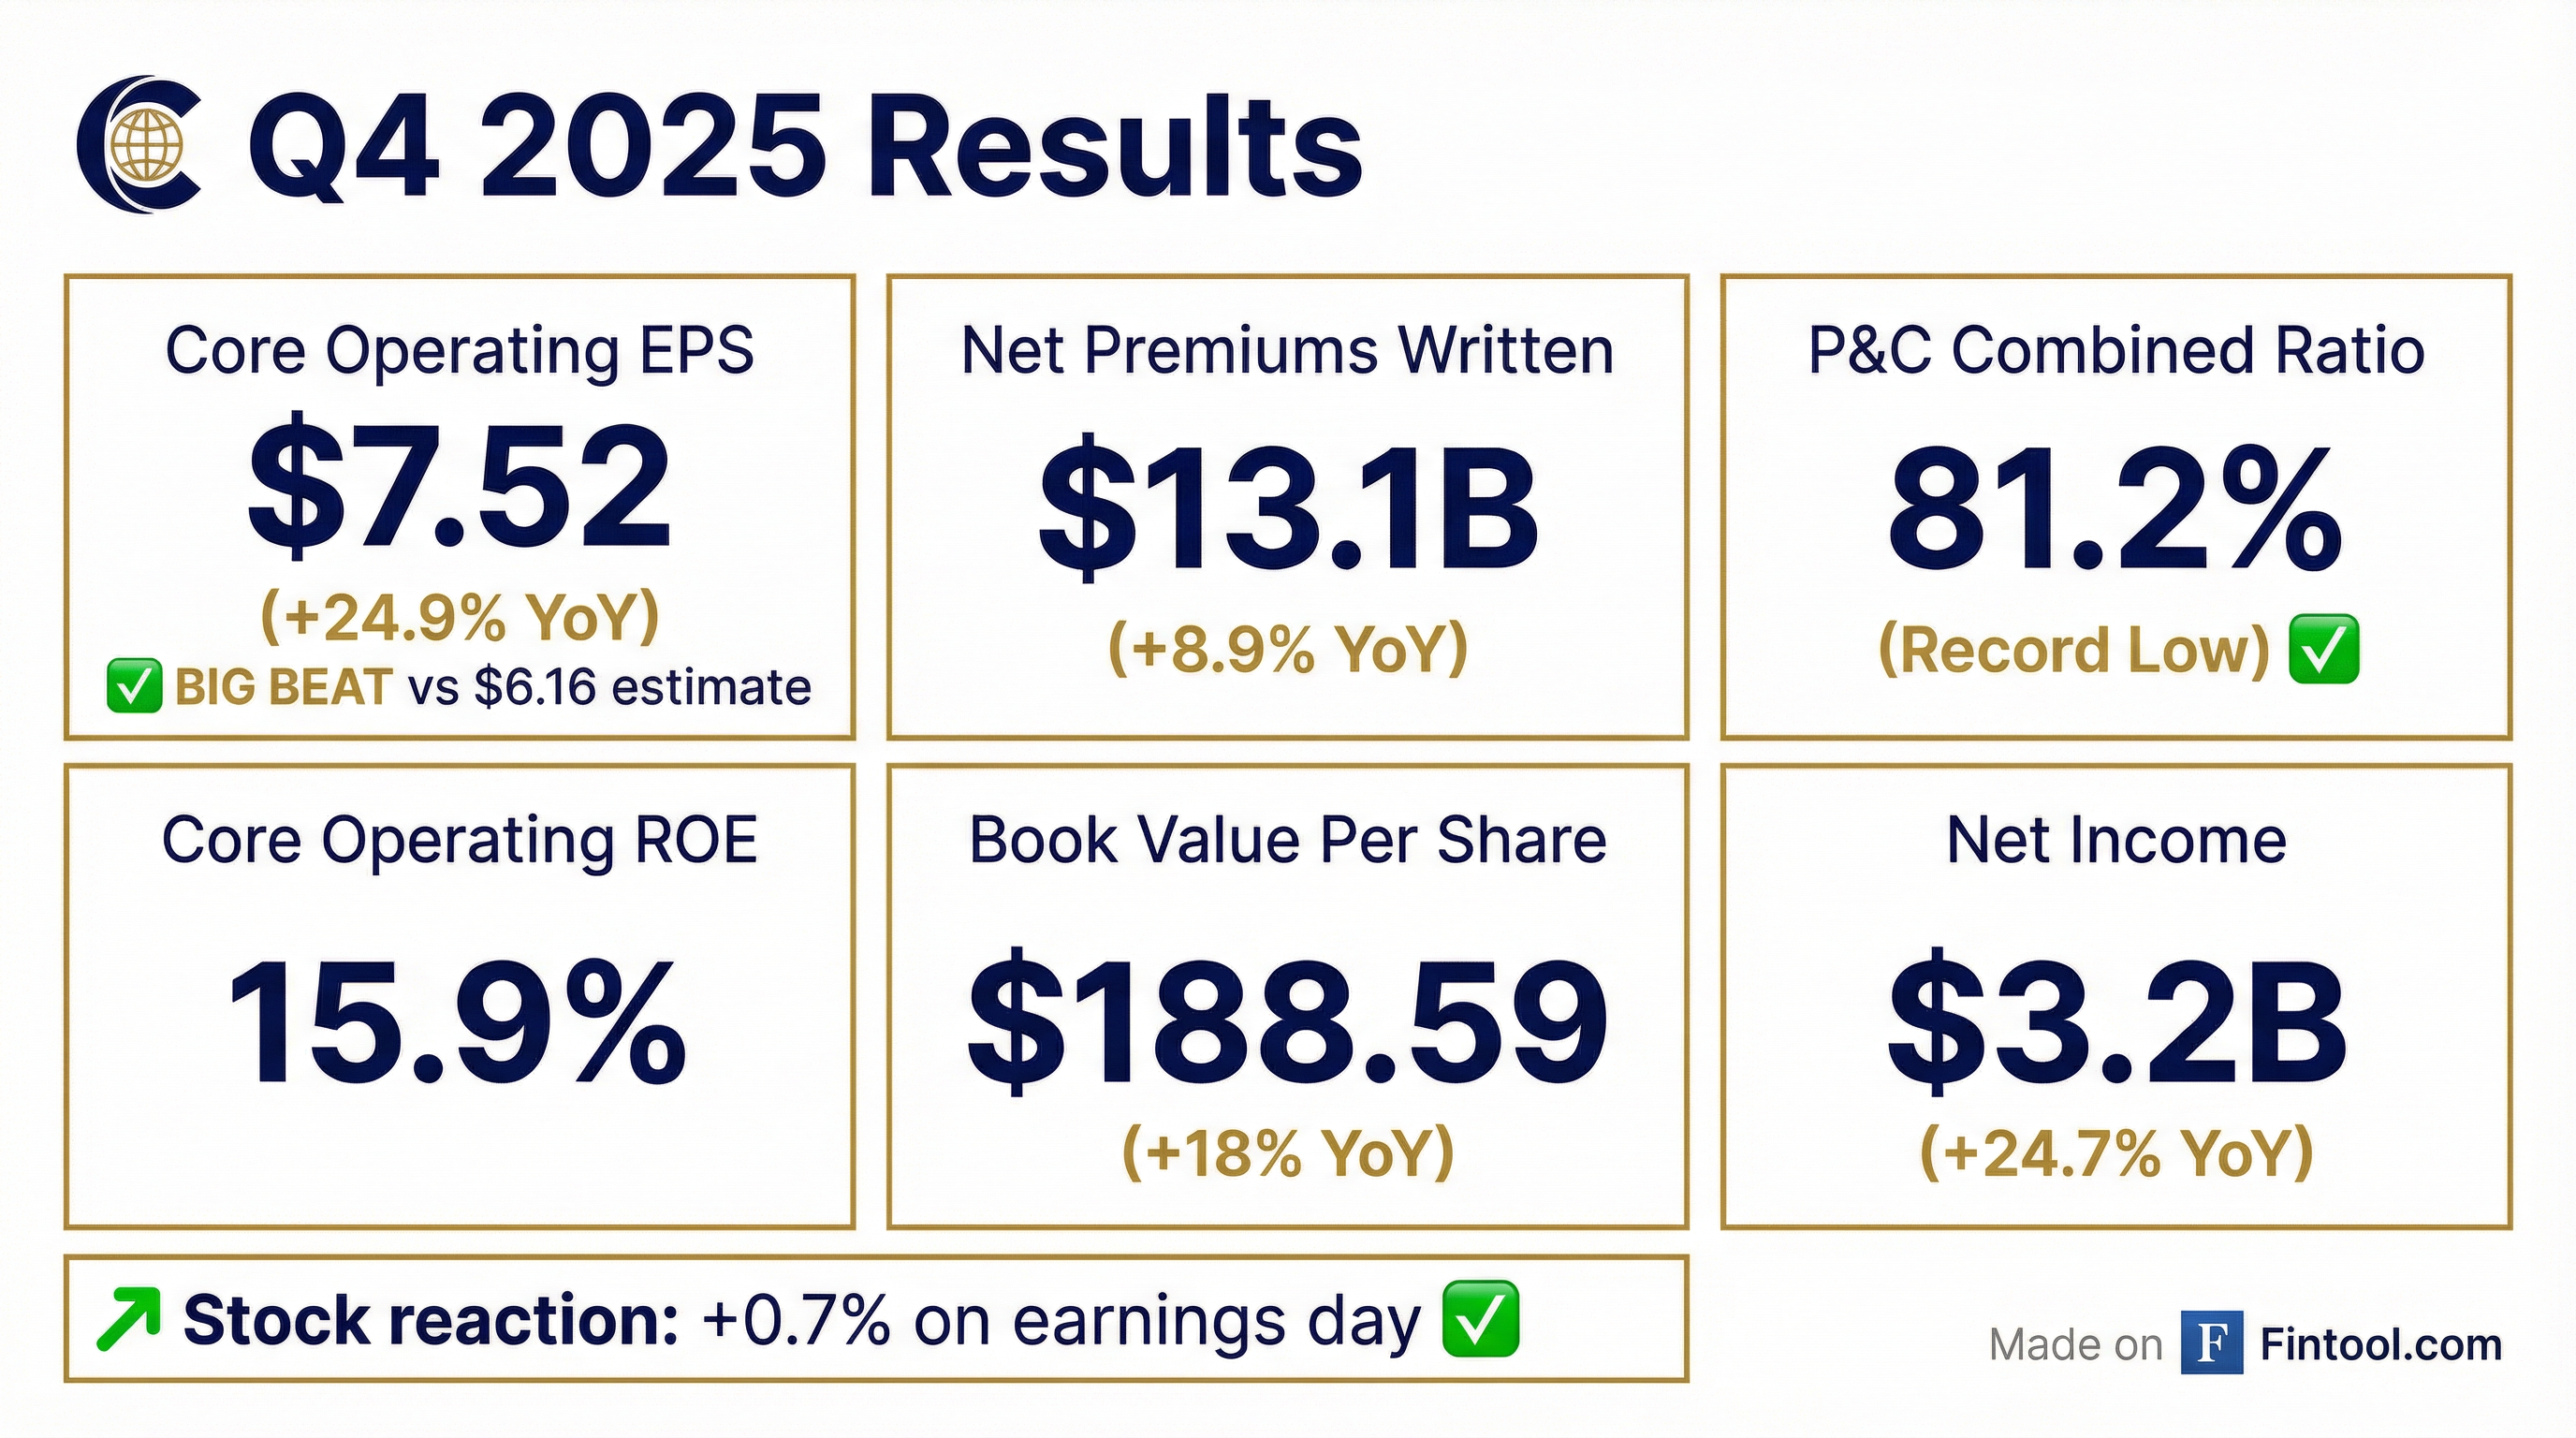
Chubb Limited (NYSE: CB) reported Q4 2025 results that crushed expectations across the board. Core operating EPS of $7.52 beat the $6.16 consensus by 22%, driven by record underwriting profitability and strong premium growth. The P&C combined ratio of 81.2% marked the best quarter in company history.
This extends Chubb's streak to nine consecutive quarters of EPS beats—a testament to disciplined underwriting and the benefits of global diversification.
Did Chubb Beat Earnings?
Chubb delivered a decisive beat on all key metrics:
GAAP EPS came in at $8.10, up 28% YoY, while net income reached $3.21 billion, up 24.7% from Q4 2024.
The beat was broad-based: underwriting income surged 39.6%, investment income hit records, and catastrophe losses were manageable at $365 million (3.0 points on the combined ratio) versus $607 million a year ago.
How Did Premiums Grow?
Net premiums written of $13.13 billion grew 8.9% YoY (8.3% in constant dollars), accelerating from the full-year average of 6.6%.
Standout performers:
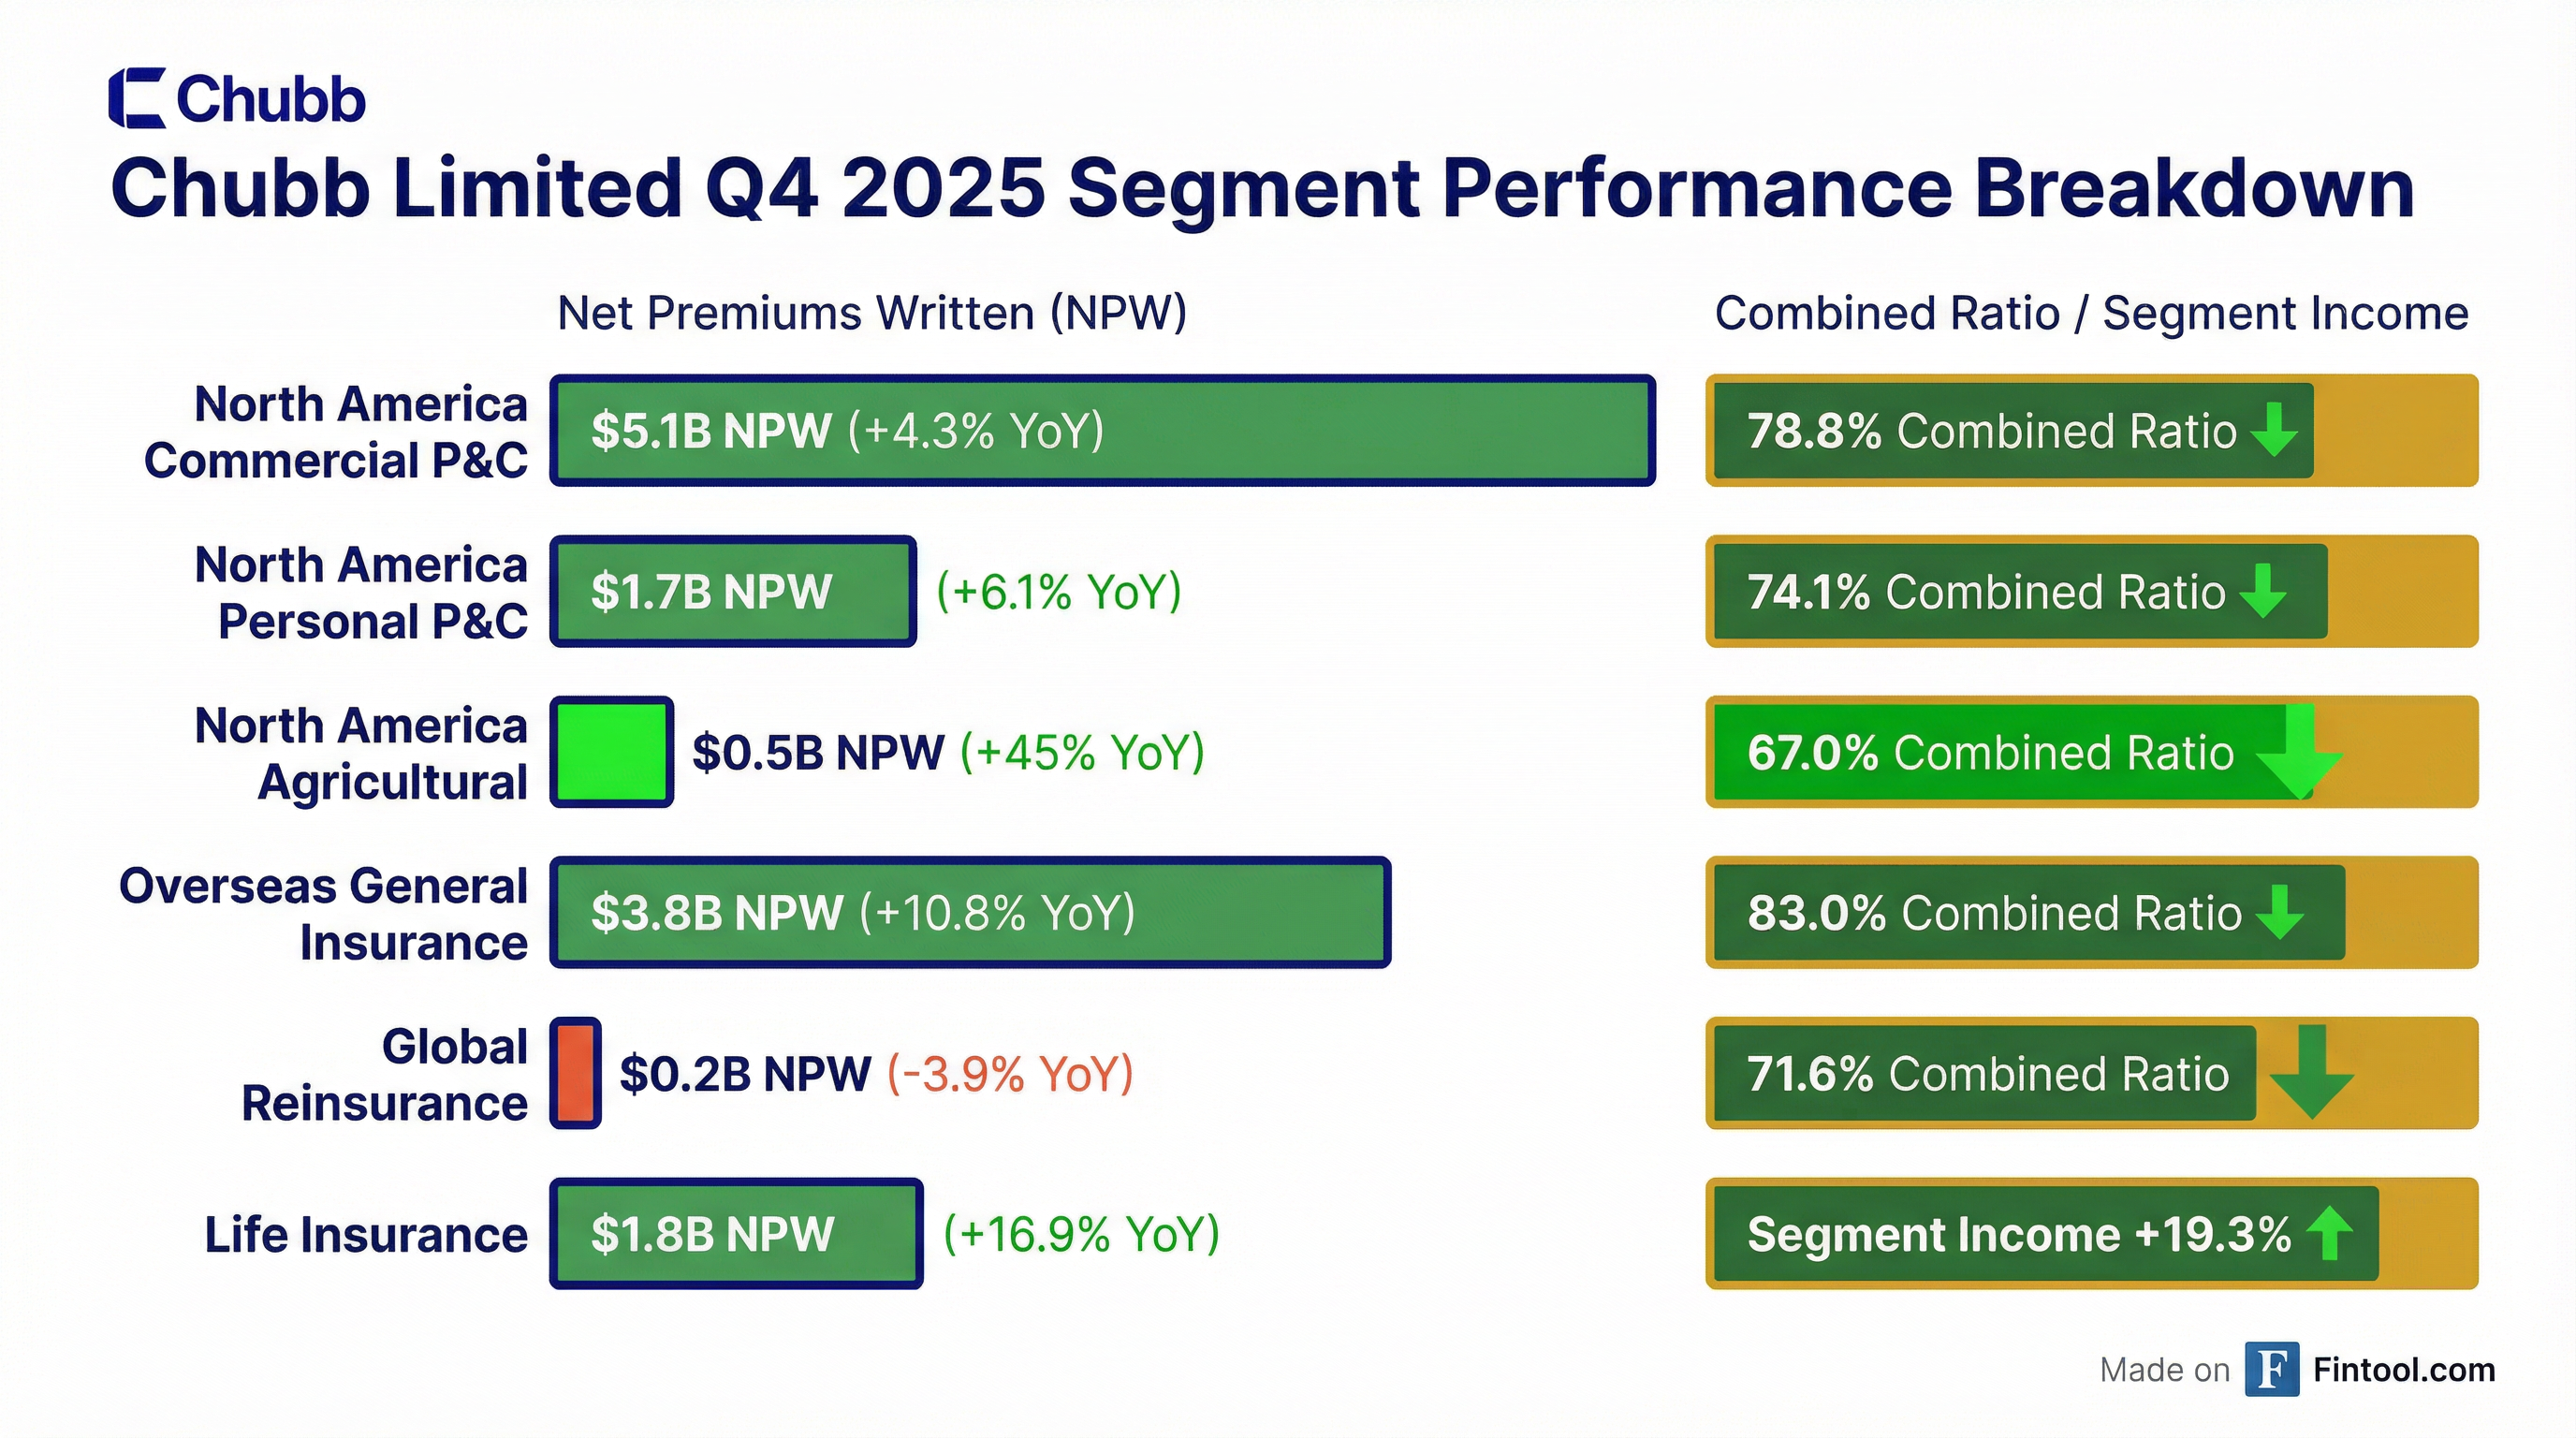
- Agricultural insurance surged 45% due to favorable government profit-share adjustments and a record 67% combined ratio
- Life insurance grew nearly 17% with segment income up 19.3%
- Overseas General delivered 10.8% growth (8%+ in constant dollar) with consumer lines up 18.7%, driven by Latin America (+14.7%), Asia (+13%), and Europe (+7%)
Geographic Diversification (2025F NPW of $56.9B):
The international business (41% of revenue) operates across 51 countries with enormous growth opportunities in a $3.8 trillion addressable market.
What Did Management Guide?
CEO Evan Greenberg struck a confident tone about 2026:
"We anticipate an excellent '26 with strong growth in operating earnings and double-digit growth in EPS and tangible book value, macro conditions notwithstanding."
Key forward-looking comments:
- Market conditions improving: "At January 1, conditions were a bit more favorable than we had anticipated, and while early, we've had a good start to the year"
- Pricing still favorable: While commercial insurance is "incrementally more competitive," Chubb sees "many opportunities for growth" across geographies, products, and distribution
- Investment income momentum: Q1 2026 adjusted NII guided to $1.81-$1.84 billion
- January 1 renewals: "Conditions were a bit more favorable than we had anticipated... we've had a good start to the year"
- Tax rate: 2026 core operating effective tax rate expected at 19.5%-20%
What Did the Q&A Reveal?
Key insights from analyst questions:
On Commercial Pricing Dynamics:
- Property pricing down 13.5% in large account business and E&S, but up 3.7% in middle market/small commercial
- Casualty pricing up 8.5% (rates up 7.6%, exposure up 0.8%)
- Financial lines pricing down 1.5%; comp middle market pricing down ~1%
Green Shoots in Financial Lines (John Keough):
- First rate increase on public D&O in many quarters
- Transaction liability terms and conditions "a lot more rational" than last two years
- Employment practices liability pushing rate across the board
On Homeowners Regulation (Evan Greenberg):
"I would be careful when politicians think about that issue of affordability pointing to insurance as a culprit. We intermediate money. We don't print money... For Chubb, loss costs in homeowners are rising around 7.5%-8%... Inflation for liability is roughly 9%, 7%-9%. And that's multiples of CPI. That's a problem with litigation."
On Data Center Opportunity (Greg Peters question):
"We are one of the few that writes insurance around the broad variety of exposures globally that those who are constructing data centers confront."
Chubb covers: Builders' Risk, primary property, engineering, marine, surety, professional lines for design, and utility/energy. The company has "doubled down" on structuring teams to pursue this opportunity globally. However, Greenberg cautioned against being "overly breathless" given headwinds around energy availability, labor, and supply chains.
On Latin America Growth (Bob Huang question): Key distribution partnerships driving consumer growth:
- Banco de Chile (Chile's largest bank)
- Nubank (Brazil - digital)
- Banco de Guayaquil (Ecuador)
- Banamex (Mexico - exclusive insurance partner, expected to accelerate after Citi sale)
On Digital Transformation Constraints (Matthew Heimermann): The only significant constraint is from digital distribution partners whose priorities for their core business may slow connectivity and data integration.
How Strong Was Underwriting?
The P&C underwriting income of $2.20 billion jumped 39.6% YoY, with the combined ratio of 81.2% beating the prior-year 85.7% by 4.5 points.
What drove the improvement:
The current accident year combined ratio excluding catastrophe losses was 80.4%, also a record, reflecting the structural quality of Chubb's book. Excluding agriculture, the global P&C current accident year combined ratio was 80.9%, almost a full point better than prior year.
Prior Period Reserve Development (Q4 2025):
- Active companies: Favorable $430 million (64% short tail, 36% long tail)
- Corporate runoff: Adverse $162 million (primarily asbestos review)
Full-year 2025 underwriting:
- P&C underwriting income: $6.53 billion (+11.6%)
- Combined ratio: 85.7% (record low for a full year)
- CAT losses: $2.92 billion vs $2.39 billion prior year, driven by California wildfires in Q1
How Did the Stock React?
CB shares rose modestly on the day of the release:
The muted reaction despite a massive EPS beat suggests the market had already priced in strong results. CB is now trading near all-time highs with a market cap of $125 billion.
What Changed From Last Quarter?
*Q3 2025 data from prior filings
Notable shifts:
- Premium growth accelerated from 5.3% to 7.7%
- Combined ratio improved another 60bps to new record
- Life insurance growth remained strong at 17%+
What About Full-Year 2025?
Chubb's full-year results were the best in company history:
Core operating ROE was 13.7% and ROTE was 20.5%, reflecting excellent capital efficiency.
Capital Return and Balance Sheet
Chubb returned $4.91 billion to shareholders in 2025:
- Share repurchases: $3.39 billion at avg. price of $282.57/share
- Dividends: $1.52 billion
Q4 2025 capital return:
- Repurchases: $1.10 billion (3.9M shares at $283/share)
- Dividends: $381 million
Balance sheet strength:
- Total investments: $168.7 billion
- Total equity: $79.8 billion
- Debt/Capital: 18.8%
Investment Income Trends
Adjusted net investment income reached a record $1.81 billion, up 7.3% YoY. Invested assets now stand at $169 billion, up from $151 billion a year ago.
The fixed income portfolio duration is 4.7 years with an average credit quality of A/A.
Private Investment Strategy
Chubb is expanding its private investments from ~12% to ~15% of its $166 billion portfolio, partnering with blue-chip private asset managers. Key highlights:
- Strategic Holdings Partnership with KKR: $7.5 billion NAV, ~15% IRR target, $330 million annual yield growing to ~$1 billion medium-term
- Private equity IRRs: ~16% to date
- Private credit yields: ~10% IRR with ~7% cash yields on average
- Income growth target: Operating income from private investments expected to grow from ~$0.9 billion to ~$2 billion annually
What's the Long-Term Strategy?
Chubb outlined an ambitious digital transformation roadmap at its December 2025 investor presentation:
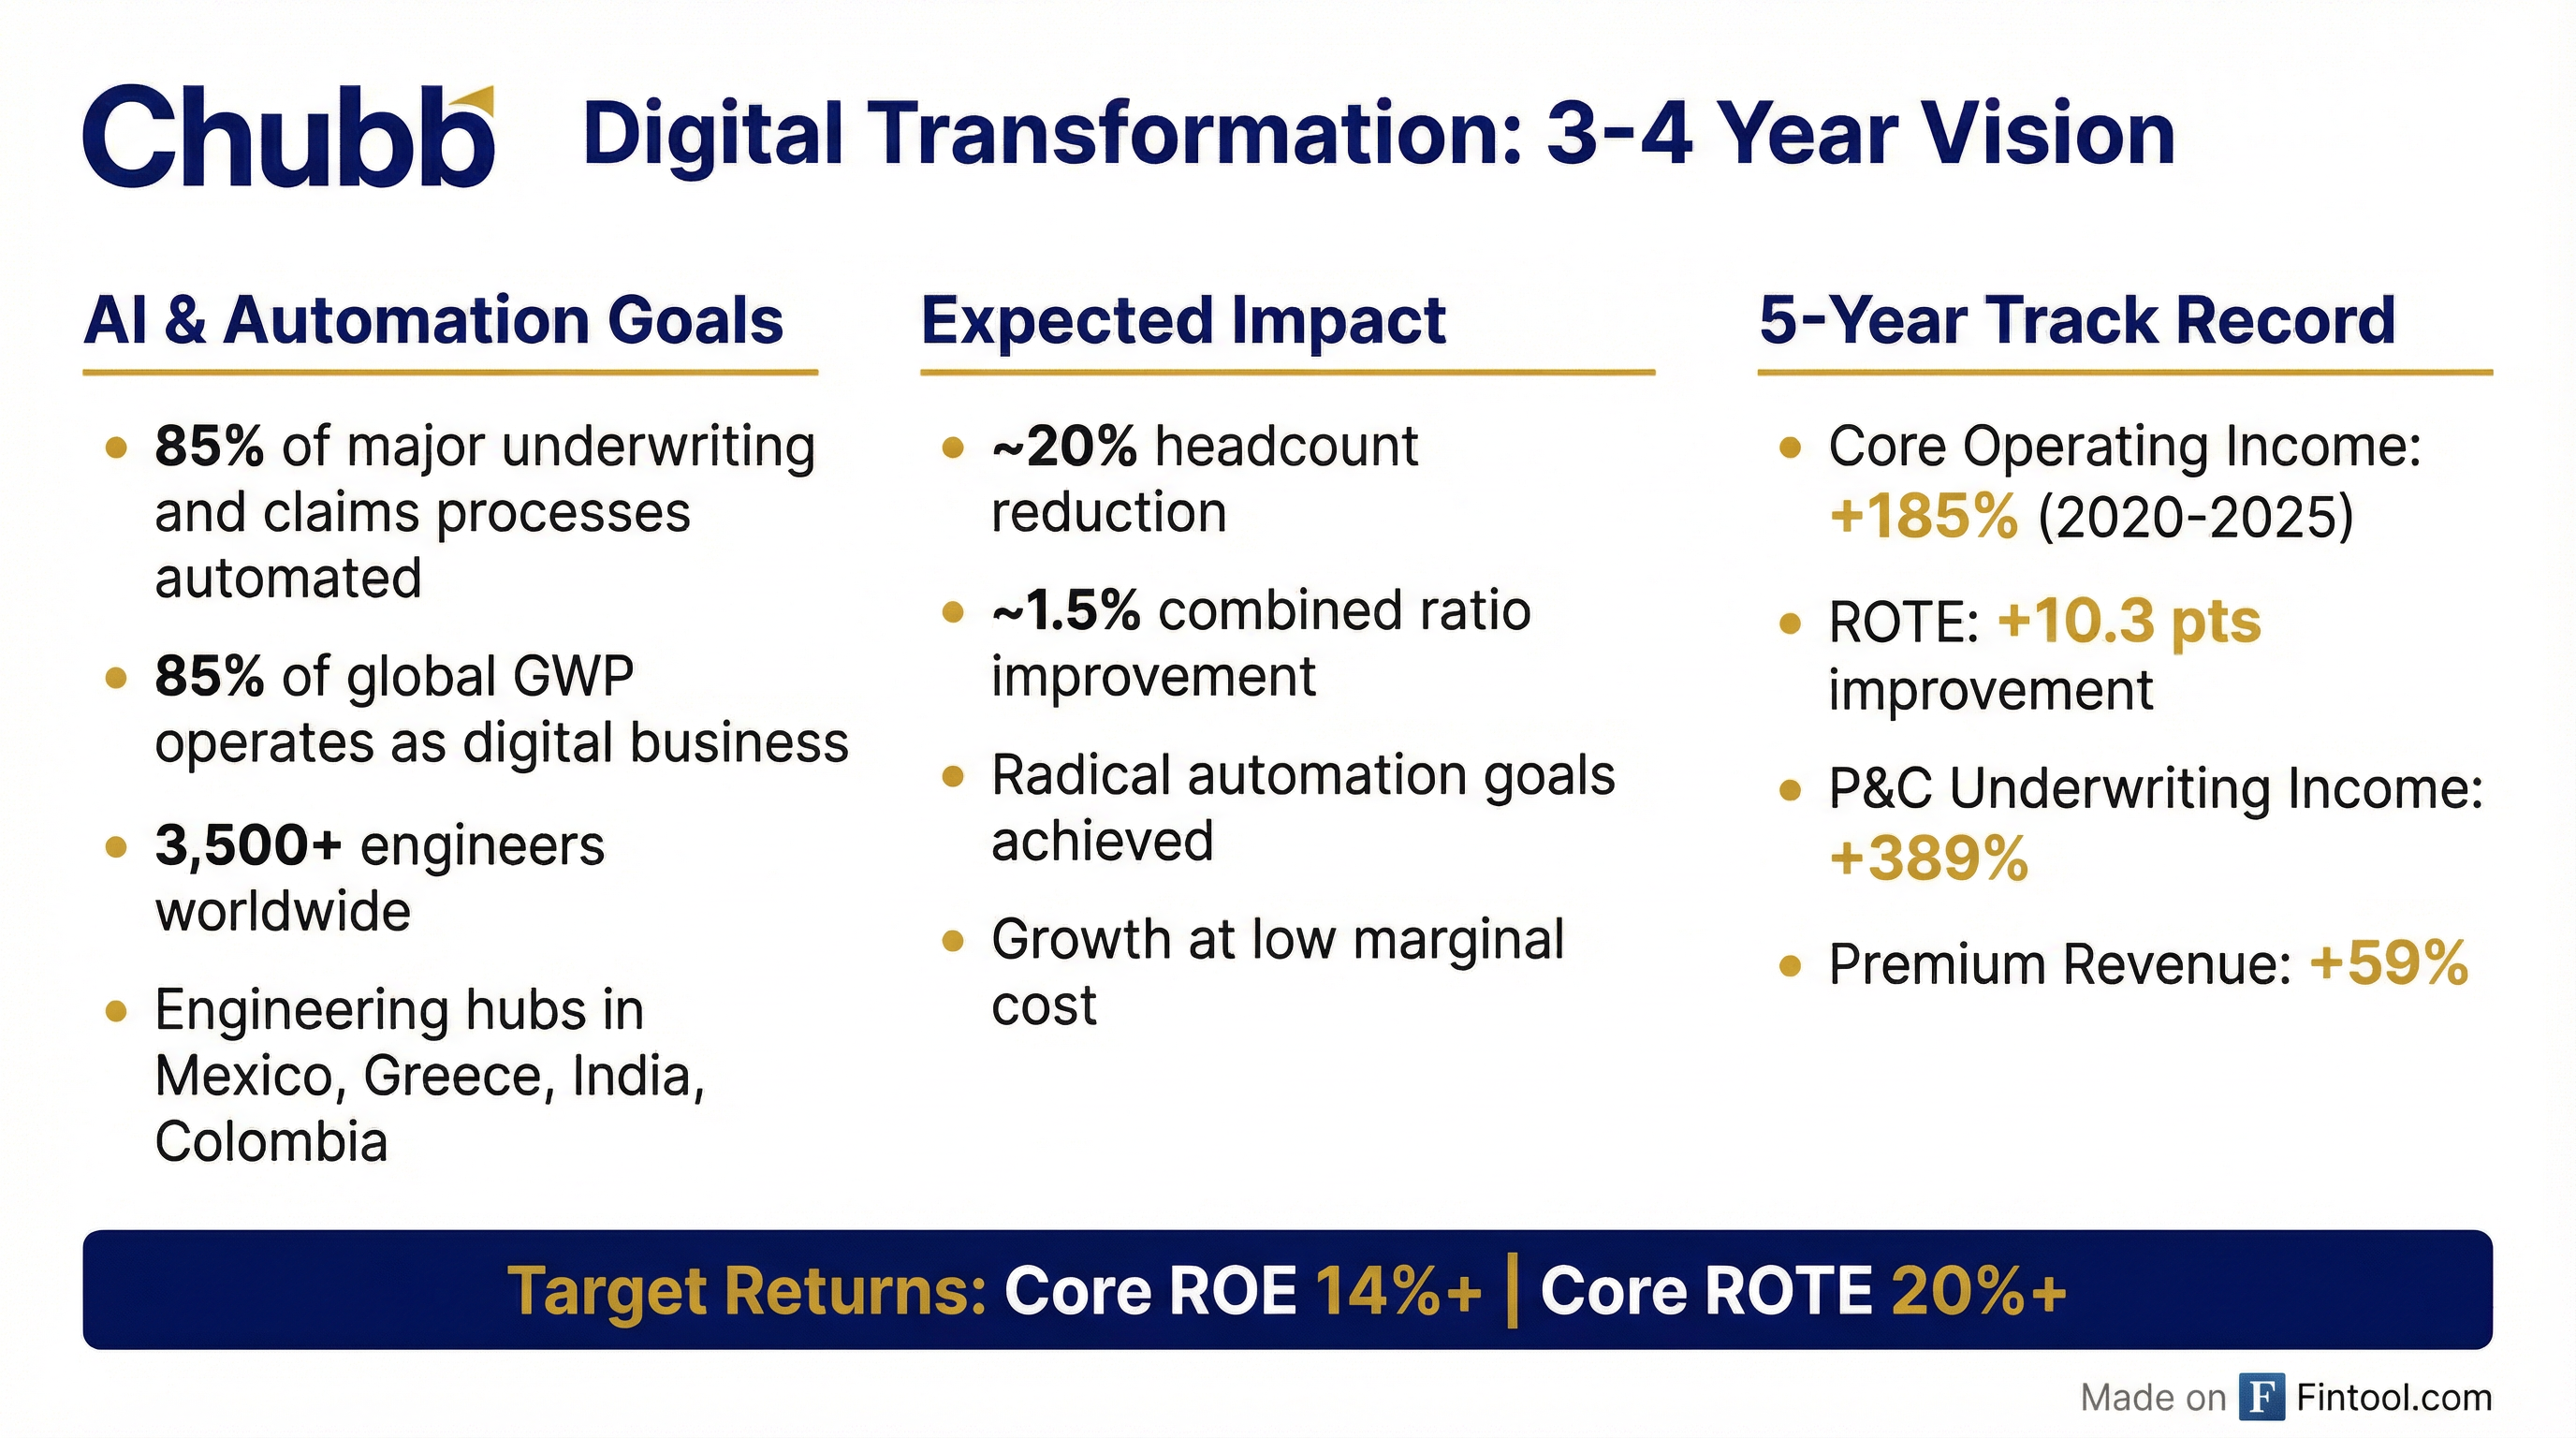
3-4 Year Digital Transformation Vision:
Technology Investments:
- 3,500+ engineers globally with hubs in Mexico, Greece, India, and Colombia
- Significant investments in data centers, AI algorithms, and LLMs
- In-house Insurtech: $1.3 billion business, profitable and growing quickly
AI Applications Across the Business:
- Commercial underwriting: Ingest, enrich, prioritize, risk assess, rate and recommend
- Consumer sales: Customer engagement and personalization
- Claims: Severity prediction and next-best actions
- Portfolio management: Real-time scenario analysis and dynamic pricing
On Culture and Transformation (Evan Greenberg on Q&A):
"Part of our culture is an ability and a willingness to adapt, to change, to be earnest. It's a meritocracy where you're rewarded for what you achieve... The vast majority in this organization work hard towards achieving it with an open mind. And we support each other."
Long-Term Return Targets (medium-term):
- Core ROE: 14%+
- Core ROTE: 20%+
- Double-digit EPS and tangible book value growth
5-Year Track Record: Standout Performance
Chubb's Q4 results cap a remarkable five-year transformation:
What drove the outperformance:
- Combined ratio advantage vs. peers: 7% points better over 3, 5, 10, and 20 years
- Admin ratio leadership: 8.2% vs. 14.2% for peers over last 5 years
- Global Life revenue growth: +136% (from $4.1B to $9.6B)
Capital allocation (2021 to Q3 2025): Of $36 billion in operating income, 59% was returned to shareholders through buybacks and dividends, 41% retained for growth
Key Risks and Concerns
While results were stellar, watch for:
- Competitive pressure in commercial lines: Greenberg noted the market is "incrementally more competitive"
- CAT exposure: Full-year CAT losses were $2.92B, up from $2.39B, largely from California wildfires
- Life insurance volatility: Q1 2025 saw a significant dip to $3.68 EPS due to CAT losses and market impacts
The Bottom Line
Chubb delivered a blowout Q4 with a 22% EPS beat, record combined ratios, and accelerating premium growth. Management's confident guidance for double-digit EPS and book value growth in 2026 suggests the momentum continues.
Bull case:
- Disciplined underwriting with 7-point combined ratio advantage vs. peers over 20 years
- Digital transformation targeting ~1.5% combined ratio improvement and 20% headcount reduction
- Private investment income growing from $0.9B to $2B annually
- Global diversification with 41% international revenue and $3.8T addressable market
Bear case:
- Competitive pricing pressure in commercial lines
- Elevated CAT activity (California wildfire exposure)
- Execution risk on ambitious automation targets
The earnings call was held February 4, 2026 at 8:30 AM ET.
Data sourced from Chubb Limited Q4 2025 8-K filed February 3, 2026, December 2025 Investor Presentation, and S&P Global.